Français
Predictive Simulation Software and Digital Twin Solutions
Looking for Lanner or Witness Simulation Software? We are now part of Haskoning. Harness the power of our predictive simulation and digital twin software to gain deep insights and foresight for answering complex questions.
Contact Us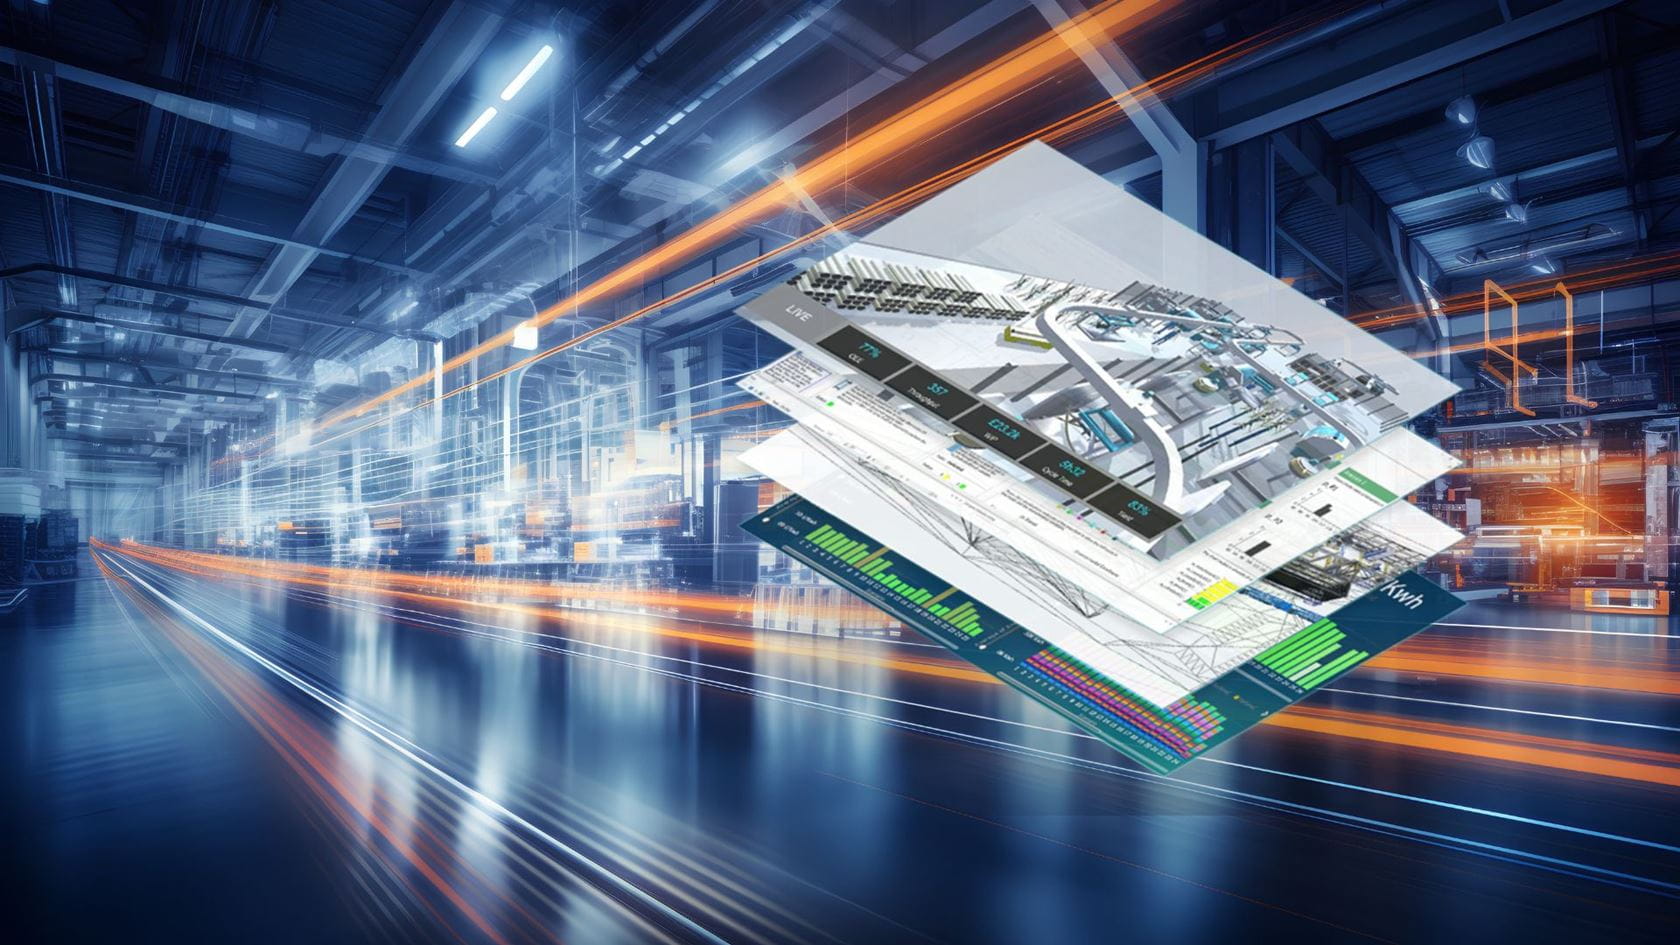
Predictive Simulation Suite
Predictive simulation software helps to build dynamic models of processes and operations to improve productivity and maximise profitability
Learn moreWitness Simulation Software
Validate decisions in a risk-free environment by using virtual models of your existing and planned facilities and operations
Learn moreDigital Twins
Drive value and build business resilience with Digital Twins to implement meaningful and valuable change
Learn moreExpert training and support

Simulation Modelling Training
Comprehensive, customisable training led by our professional team of trainers, consultants and product experts.
Learn more
Modelling Support and Consulting
Expert simulation modelling support and consulting for scalable solutions across all industries.
Learn more